Hardware Setup-
» Connect your oscilloscope to the DDSOP SMA connector and connect your spectrum analyzer to the DDSON SMA connector.
» Set your clock to the desired frequency with 3 dBm power. Connect your clock to the DDSCK SMA connector.
IMPORTANT: Do not turn on the outputs to the power supplies just yet. First set the voltage and current limits
to the following:
| Voltage (V) | Current (mA) | |
| -5.0 | 1500 | |
| +5.0 | 200 | |
| +3.3 | 150 | |
| +1.8 | 750 |
» Hook the power plug into the power header. You should have already set up the plug so that the wires are in the correct order. For details on setting up the plug, please see Power Plug Setup in the Hardware Requirements section.
NOTE: As you can see in the table above, the current on the -5 V supply is very large so the wire that you use should be of high quality and low resistance. If the wire is of low quality, a fairly significant voltage drop will occur in the wire and DSM performance might suffer.
NOTE: When unplugging the power plug from the header, please grab and pull the actual plug and not the wires. Pulling the wires may cause them to lose their connection to the plug and will degrade DSM performance.
» IMPORTANT: You must turn on the power supply outputs in the following order:
- -5V and +5V (can turn on in any order)
- +1.8V and +3.3V (can turn on in any order)
» Connect the DSM board to your PC with the USB cable.
» Schematically, the connections should look something like the diagram below:

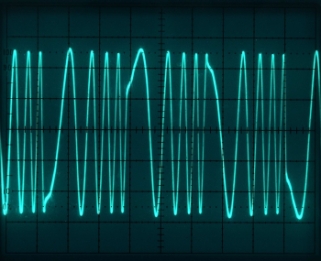
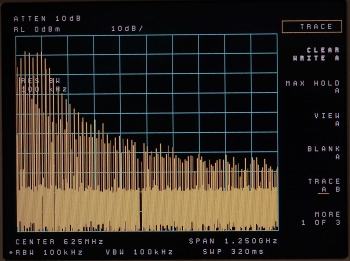
» If you have done everything correctly, you should see the built-in waveform output on your
oscilloscope and your spectrum analyzer.
The built-in linear chirping waveform is pre-stored in the firmware and is automatically loaded at startup.
Even with a PC connected to the DSM, the built-in waveform is loaded and the chirping runs before the PC
downloads a new waveform to the board. The built-in chirping waveform is a 16-point cyclic linear waveform
sweeping from 1/256 to 1/16 of the clock frequency with frequency update at 8 clock cycles. The left
picture shows a time-domain CW waveform and the right picture shows the instant spectrum from DC to the
Nyquist frequency.
|
|